As Dave mentioned in his prior post, our recently published eBook, Addressing Uncertainty in Multisector Dynamics Research, provides several interactive tutorials for hands on training in model diagnostics and uncertainty characterization. This blog post is a preview of an upcoming extension of these trainings featuring an interactive tutorial on creating synthetic streamflow scenarios using a Hidden-Markov Modeling (HMM)- based approach specifically for the Upper Colorado River Basin. This training heavily utilizes Julie Quinn’s prior tutorial on fitting an HMM-based streamflow generator and is inspired by her Earth’s Future paper on understanding if exploratory modeling can truly be scenario-neutral.
In this post, we will primarily be focusing on decadal hydrologic drought in the region as a metric of interest to explore in the historic period, the stationary-synthetic, and non-stationary synthetic ensembles. We will also explore how to place CMIP5 climate projections in the context of our synthetically-created ensembles. All code for this demo is available in a Jupyter Notebook on Github that follows the progression of this blog step by step (though some content may be subject to change before going into the eBook formally). The code is written in Python.
Background
In the Western United States, and particularly the Colorado River Basin, recent studies have used tree-ring reconstructions to suggest that the megadrought that has been occurring in the Southwest over the past 22 years is the regions worst drought since about 800 AD (Williams et al., 2022). The study’s lead author, UCLA climatologist Park Williams, suggested that had the sequence of wet-dry years occurred as observed but without the human-caused drying trend, the 2000s would have likely still been dry, but not on the same level as the worst of the last millennium’s megadroughts.
Lake Powell shows persistent effects from drought (Source: U.S. Bureau of Reclamation)
The recent trend of warming and reduced soil moisture in the SW is becoming extremely problematic from a water systems planning and management perspective for the Colorado River Basin. It has becoming rapidly clear that the river is completely over-allocated and won’t be able to sustain flow requirements as dictated by the Colorado Compact. Thus, there has been an increasing focus in understanding how susceptible water systems in this region are to plausible future streamflow scenarios, particularly those that may contain persistent droughts. In this tutorial, we’ll discuss how to create these scenarios using a Hidden Markov Model (HMM)- based synthetic generator.
Observed Data
First let’s take a look at the observed data from 1909-2013 for the outlet gauge of the Upper Colorado River that is located at the CO-UT stateline. Below we create a plot of the annual streamflow. Let’s also add an 11-year rolling mean which will give us a sense of long-term averaged behavior.
The Colorado Compact prescribing flows between the Upper and Lower Colorado Basins was negotiated using data prior to 1922, which we now know was one of the consistently wetter periods in the record. It’s clear today that since the 1980s, the Southwest has been experiencing imminent aridification and that this observed record alone isn’t an accurate representation of what future climate might look like in this region.
Let’s get a little more specific and formally quantify decadal drought risk in the observed period. We use a metric proposed in Ault et al. (2014). The authors define a decadal drought as a streamflow value that is more than a half a standard deviation below the 11-year running mean of the available record.
By this metric, the Upper Colorado Basin region has experienced two decadal droughts in the past 100 years.
Synthetic Stationary Generator to Understand Natural Variability
It is important to remember that the historical record of the region is only one instance of streamflow, which ultimately comes from an inherently stochastic and chaotic system (the atmosphere). We require a tool that will allow us to see multiple plausible realizations of that same variability. The tool that we use to develop synthetic flows for the region is a Gaussian Hidden Markov Model. If a system follows a Markov process, it switches between a number of “hidden states” dictated by a transition matrix. Each state has its own Gaussian probability distribution (defined by a mean and standard deviation) and one can draw from this distribution to create synthetic flows that fit the properties of the historical distribution. HMMs are an attractive choice for this region because they can simulate long persistence, particularly long droughts, which is an important consideration for water systems vulnerabilities. The figure below shows an example of a 2-state Gaussian HMM that we will fit for the region.
At this point, I will direct readers to either Julie’s blog or my own Jupyter notebook, which have all the details and code required to fit the model and investigate the parameters. Now let’s create a sample 105-year synthetic realization and see what the drought dynamics look like in the synthetic scenario that we created.
Wow, it looks like we’ve created something like a megadrought type situation by just sampling within the bounds of the historical distribution! You can keep sampling from the model to create more 105-year traces and note how the location and number of decadal droughts changes. Maybe you will experience two like in the the historical period, or fewer or more. Re-sampling from the model will demonstrate how different 105-year traces can look just within the range of natural variability and that what we’ve observed historically is only one trace. It’s also important to remember that when droughts occur can also define the ultimate effect of the drought (i.e. is it at a time when there is a large population growth or a time when humans can adapt by conserving or building more infrastructure?). A hydrologic drought need not manifest into an agricultural drought of the same magnitude if stored surface water is available, for example.
Non-Stationary Synthetic Generator to Impose Climate Changes
Now, we want to be able to create flows under non-stationary conditions to get a better understanding of what flows can look like under climate changes. In order to create flows under non-stationary conditions, we can toggle the parameters of the HMM model in order to create systematic changes to the model that can represent a changing climate. The HMM has 6 parameters that define it. In the historical distribution, we fit a baseline value for these parameters. In this non-stationary generator, we define a range to sample these parameters from.
Parameter
Current Value
Lower Bound
Upper Bound
Log-Space Wet State Mean Multiplier
1.00
0.98
1.02
Log-Space Dry State Mean Multiplier
1.00
0.98
1.02
Log-Space Wet State Standard Deviation Multiplier
1.00
0.75
1.25
Log-Space Dry State Standard Deviation Multiplier
1.00
0.75
1.25
Change in Dry-Dry Transition Probability
0.00
-0.30
+0.30
Change in Wet-Wet Transition Probability
0.00
-0.30
+0.30
Now refer to the Jupyter notebook for the code for the following steps. We first sample from these parameter ranges 1000 times using the Latin Hypercube Sample functionality within SALib. We then swap out the baseline parameters with the newly sampled parameters and sample from the model. Below is an example trace from the new non-stationary model in which we are generating more instances of decadal drought.
Placing Non-Stationary Flows in the Context of CMIP5 Projections
By creating a non-stationary generator, we can broaden the drought conditions that we are creating which that can be very useful to understand how our water systems model performs under potentially extreme scenarios. However, it’s useful to place our synthetically generated flows in the context of physically-driven CMIP5 projections to get a better understanding of how the two approaches compare. This example makes use of 97 CMIP5 projections used in the Colorado River Water Availability Study (CWCB, 2012). In each of these projections, monthly precipitation factor changes and temperature delta changes were computed between mean projected 2035–2065 climate statistics and mean historical climate statistics from 1950–2013. These 97 different combinations of 12 monthly precipitation multipliers and 12 monthly temperature delta shifts were applied to historical precipitation and temperature time series from 1950–2013. The resulting climate time series were run through a Variable Infiltration Capacity (VIC) model of the UCRB, resulting in 97 time series of projected future streamflows at the Colorado‐Utah state line.
We can fit an HMM to each trace of projected streamflow and retain the fitted parameters. Then we take the ratio between these parameters and the baseline HMM parameters in order to ultimately have a set of multipliers associated with each CMIP5 projection. This allows us to place the CMIP5 projections into the same space that we are sampling for our synthetic realizations.
In order to visualize these two ensembles in the same space, we plot a response surface that allows us to map how combinations of HMM parameters tend to lead to increased decadal drought occurrence. In order to get a continuous surface, we’ll fit a non-linear regression that ultimately maps the parameter values to decadal drought occurrence over a set of grid points. This response surface is shown by the color gradient below.
We choose two parameters, the dry-dry transition probability and the dry mean, that would most likely influence the decadal drought occurrence and create the response surface (note that a more formal sensitivity analysis can be used to identify the top most influential parameters as well). From the response surface, you can see that we’re more likely to see more instances of decadal droughts when we (1) increase the dry-dry transition probability, which inherently will increase persistence of the dry state, and (2) when we make the dry state log mean drier. We also place those multipliers from the CMIP5 projections into the space as white dots. Note that these CMIP5 projections tend to span the extent of the dry mean sample space, but are less representative of the dry transition probability sample space, particularly the increase in the dry-dry transition probability which leads to more persistent droughts. This suggests that the types of hydrological droughts represented in the projections tend to only be wetter to slightly drier than our baseline.
Both methods of producing these scenarios are valid, though if your goal is to produce a variety of ensembles that are characterized by many different drought characteristics, you will likely find that a generator approach will serve this purpose better.
Concluding Remarks
If you have any questions about the notebook or feedback as you go through the tutorial, please post below in the comments section or email me. We love getting as much feedback as possible before publication in the eBook.
References
Ault, T. R., Cole, J. E., Overpeck, J. T., Pederson, G. T., & Meko, D. M. (2014). Assessing the risk of persistent drought using climate model simulations and paleoclimate data. Journal of Climate, 27(20), 7529-7549.
CWCB (2012).Colorado River Water Availability Study Phase I Report. Colorado Water Conservation Board
Williams, A. P., Cook, B. I., & Smerdon, J. E. (2022). Rapid intensification of the emerging southwestern North American megadrought in 2020–2021. Nature Climate Change, 12(3), 232-234.
Our recently published eBook, Addressing Uncertainty in Multisector Dynamics Research, provides several interactive tutorials for hands on training in model diagnostics and uncertainty characterization. This blog post is a preview of an upcoming extension of these trainings featuring an interactive tutorial on time-evolving scenario discovery for the development of adaptive infrastructure pathways for water supply planning. This post builds off the prior tutorial on gradient-boosted trees for scenario discovery.
I’ll first introduce a styled water supply test case featuring two water utilities seeking to develop a cooperative infrastructure investment and management policy over a 45-year planning horizon. I’ll then demonstrate how the utilities can explore evolving vulnerability across the planning period. All code for this demo is available on Github. The code is written in Python, but the workflow is model agnostic and can be paired with simulation models in any language.
Background
The Bedford-Greene metropolitan area (Figure 1) is a stylized water resources test case containing two urban water utilities seeking to develop an infrastructure investment and management strategy to confront growing demands and changing climate. The utilities have agreed to jointly finance and construct a new water treatment plant on Lake Classon, a large regional resource. Both utilities have also identified a set of individual infrastructure options to construct if necessary.
Figure 1: The Bedford-Greene metropolitan area
The utilities have formulated a cooperative and adaptive regional water supply management strategy that uses a risk-of-failure (ROF) metric to trigger both short-term drought mitigation actions (water use restrictions and treated transfers between utilities) and long-term infrastructure investment decisions (Figure 2a). ROFs represent a dynamic measure of the utilities’ evolving capacity-to-demand ratios. Both utilities have specified a set of ROF thresholds to trigger drought mitigation actions and plan to actively monitor their short-term ROF on a weekly basis. When a utility’s ROF crosses a specified threhold, the utility will implement drought mitigation actions in the following week. The utilities will also monitor long-term ROF on an annual basis, and trigger infrastructure investment if long-term risk crosses a threshold dictated by the policy. The utilities have also specified a construction order for available infrastructure options.
Figure 2: a) the regional infrastructure investment and management policy. b) adaptive pathways generated across 2,000 deeply uncertain SOWs
The utilities performed a Monte Carlo simulation to evaluate how this policy responds to a wide array of future states of the world (SOWs), each representing a different sample of uncertainties including demand growth rates, changes to streamflows, and financial variables.
The ROF-based policies respond to each SOW by generating a unique infrastructure pathway – a sequence of infrastructure investment decisions over time. Infrastructure pathways across 2,000 SOWs are shown in Figure 2b. Three clusters summarizing infrastructure pathways are plotted as green lines which represent the median week that options are triggered. The frequency that each option is triggered across all SOWs is plotted as the shading behind the lines. Bedford relies on the Joint Water Treatment facility and short-term measures (water use restrictions and transfers) to maintain supply reliability. Greene constructs the Fulton Creek reservoir in addition to the Joint Treatment plant and does not strongly rely on short-term measures to combat drought.
The utilities are now interested in evaluating the robustness of their proposed policy, characterizing how uncertainties generate vulnerability and understanding how this vulnerability may evolve over time.
Time-evolving robustness
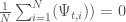
To measure the robustness of the infrastructure investment and management policy, the two utilities employ a satisficing metric, which measures the fraction of SOWs where the policy is able to meet a set of performance criteria. The utilities have specified five performance criteria that measure the policy’s ability to maintain both supply reliability and financial stability. Performance criteria are shown in Table 1.
Performance criteria
Threshold
Reliability
< 99%
Restriction Frequency
>20%
Worst-case cost
>10 % annual revenue
Peak financial cost
> 80% annual revenue
Stranded assets
> $5/kgal unit cost of expansion
Table 1: Satisficing criteria
Figure 3 shows the evolution of robustness over time for the two utilities. While the cooperative policy is very robust after the first ten years of the planning horizon, it degrades sharply for both utilities over time. Bedford meets the performance criteria in nearly 100% of sampled SOWs after the first 10 years of the planning horizon, but its robustness is reduced to around 30% by the end of the 45-year planning period. Greene has a robustness of over 90% after the first 10 years and degrades to roughly 60% after 45 years. These degradations suggest that the cooperative infrastructure investment and management policy is insufficient to successfully maintain long-term performance in challenging future scenarios. But what is really going on here? The robustness metric aggregates performance across the five criteria shown in Table 1, giving us a general picture of evolving performance, but leaving questions about the nature of the utilities’ vulnerability.
Figure 3: Robustness over time
Figure 4 provides some insight into how utility vulnerability evolves over time. Figure 4 shows the fraction of failure SOWs that can be attributed to each performance criterion when performance is measured in the near term (next 10 years), mid-term (next 22 years), and long-term (next 45 years). Figure 4 reveals that the vulnerability of the two utilities evolves in very different ways over the planning period. Early in the planning period, all of Bedford’s failures can be attributed to supply reliability. As the planning horizon progresses, Bedford’s failures diversify into failures in restriction frequency and worst-case drought management cost, indicating that the utility is generally unable to manage future drought. Bedford likely needs more infrastructure investment than is specified by the policy to maintain supply reliability.
In contrast to Bedford’s performance, Greene begins with vulnerability to supply reliability, but its vulnerability shifts over time to become dominated by failures in peak financial cost and stranded assets – measures of the utility’s financial stability. This shift indicates that while the infrastructure investments specified by the cooperative policy mitigate supply failures by the end of the planning horizon, these investments drive the utility into financial failure in many future scenarios.
Figure 4: Failures over time
Factor mapping and factor ranking
To understand how and why the vulnerability evolves over time, we perform factor mapping. Figure 5 below, shows the uncertainty space projected onto the two most influential factors for Bedford, across three planning horizons. Each point represents a sampled SOW, red points represent SOWs that resulted in failure, while white points represent SOWs that resulted in success. The color in the background shows the predicted regions of success and failure from the boosted trees classification.
Figure 4 indicates that Bedford’s vulnerability is primarily driven by rapid and sustained demand growth and this vulnerability increases over time. When evaluated using a 22-year planning horizon, the utility only appears vulnerable to extreme values of near-term demand growth, combined with low values of restriction effectiveness. This indicates that the utility is relying on restrictions to mitigate supply failures, and is vulnerable when they do not work as anticipated. When evaluated over the 45-year planning horizon, Bedford’s failure is driven by rapid and sustained demand growth. If near-term demand grows faster than anticipated (scaling factor > 1.0 on the horizontal axis), the utility will likely fail to meet its performance criteria. If near-term demand is lower than anticipated, the utility may still fail to meet performance criteria if under conditions of high mid-term demand growth. These results provide further evidence that the infrastructure investment and management policy is insufficient to meet Bedford’s long-term water supply needs.
Figure 5: Time-evolving factor maps for Bedford
Greene’s vulnerability (Figure 6) evolves very differently from Bedford’s. Greene is vulnerable to high-demand scenarios in the near term, indicating that its current infrastructure is insufficient to meet rapidly growing demands. Greene can avoid this failure under scenarios where the construction permitting time multiplier is the lowest, indicating that new infrastructure investment can meet the utility’s near-term supply needs. When evaluated across a 22-year planning horizon, the utility fails when near-term demand is high and restriction effectiveness is low, a similar failure mode to Bedford. However, the 22-year planning horizon reveals a second failure mode – low demand growth. This failure mode is responsible for the stranded assets failures shown in Figure 3. This failure mode increases when evaluated across the 45-year planning horizon, and is largely driven by low-demand futures when the utility does not generate the revenue to cover debt service payments needed to fund infrastructure investment.
Figure 6: Time-evolving factor maps for Greene
The factor maps in Figures 5 and 6 only show the two most influential factors determined by gradient boosted trees, however, the utilities are vulnerable to other sampled uncertainties. Figure 7 shows the factor importance as determined by gradient boosted trees for both utilities across the three planning horizons. While near-term demand growth is important for both utilities under all three planning horizons, the importance of other factors evolves over time. For example, restriction effectiveness plays an important role for Greene under the 22-year planning horizon but disappears under the 45-year planning horizon. In contrast, the bond interest rate is important for predicting success over the 45-year planning horizon, but does not appear important over the 10- or 22-year planning horizons. These findings highlight how assumptions about the planning period can have a large impact on modeling outcomes.
Welcome to the second post in the Fisheries Training Series, in which we are studying decision making under deep uncertainty within the context of a complex harvested predator-prey fishery. The accompanying GitHub repository, containing all of the source code used throughout this series, is available here. The full, in-depth Jupyter Notebook version of this post is available in the repository as well.
A brief re-cap of the harvested predator-prey model
Formulation of the harvesting policy and an overview of radial basis functions (RBFs)
Formulation of the policy objectives
A simulation model for the harvested system
Optimization of the harvesting policy using the PyBorg MOEA
Installation of Platypus and PyBorg*
Optimization problem formulation
Basic MOEA diagnostics
Note *The PyBorg MOEA used in this demonstration is derived from the Borg MOEA and may only be used with permission from its creators. Fortunately, it is freely available for academic and non-commercial use. Visit BorgMOEA.org to request access.
Now, onto the tutorial!
Harvested predator-prey model
In the previous post, we introduced a modified form of the Lotka-Volterra system of ordinary differential equations (ODEs) defining predator-prey population dynamics.
This modified version includes a non-linear predator population growth dynamic original proposed by Arditi and Akçakaya (1990), and includes a harvesting parameter, . This system of equations is defined in Hadjimichael et al. (2020) as:
Where is the prey population being harvested and is the predator population. Please refer to Post 0 of this series for the rest of the parameter descriptions, and for insights into the non-linear dynamics that result from these ODEs. It also demonstrates how the system alternates between ‘basins’ of stability and population collapse.
Harvesting policy
In this post, we instead focus on the generation of harvesting policies which can be operated safely in the system without causing population collapse. Rather than assigning a deterministic (specific, pre-defined) harvest effort level for every time period, we instead design an adaptive policy which is a function of the current state of the system:
The problem then becomes the optimization of the control rule, , rather than specific parameter values, . The process of optimizing the parameters of a state-aware control rule is known as Direct Policy Search (DPS; Quinn et al, 2017).
Previous work done by Quinn et al. (2017) showed that an adaptive policy, generated using DPS, was able to navigate deeply uncertain ecological tipping points more reliably than intertemporal policies which prescribed specific efforts at each timestep.
Radial basis functions
The core of the DPS method are radial basis functions (RBFs), which are flexible, parametric function formulations that map the current state of the system to policy action. A previous study by Giuliani et al (2015) demonstrated that RBFs are highly effective in generating Pareto-approximate sets of solutions, and that they perform well when applied to horizons different from the optimized simulation horizon.
There are various RBF approaches available, such as the cubic RBF used by Quinn et al. (2017). Here, we use the Gaussian RBF introduced by Hadjimichael et al. (2020), where the harvest effort during the next timestep, , is mapped to the current prey population levels, by the function:
In this formulation and are the center, radius, and weights of each RBF respectively. Additionally, is the number of RBFs used in the function; in this study we use RBFs. With two RBFs, there are a total of 6 parameters. Increasing the number of RBFs allows for more flexible function forms to be achieved. However, two RBFs have been shown to be sufficient for this problem.
The sum of the weights must be equal to one, such that:
The function harvest_streategy() is contained within the fish_game_functions.py script, which can be accessed here in the repository.
A simplified rendition of the harvest_strategy() function, evaluate_RBF(), is shown below and uses the RBF parameter values (i.e., ), and the current prey population, to calculate the next year’s harvesting effort.
import numpy as np
import matplotlib.pyplot as plt

def evaluate_RBF(x, RBF_params, nRBFs):
    """
    Parameters:
    -----------
    x : float
        The current state of the system.
    RBF_params : list [3xnRBFs]
        The RBF parameters in the order of [c, r, w,...,c, r, w].
    nRBFs : int
        The number of RBFs used in the mapping function.

    Returns:
    --------
    z : float
        The policy action.
    """

    c = RBF_params[0::3]
    r = RBF_params[1::3]
    w = RBF_params[2::3]

    # Normalize the weights
    w_norm = []
    if np.sum(w) != 0:
        for w_i in w:
            w_norm.append(w_i / np.sum(w))
    else:
        w_norm = (1/nRBFs)*np.ones(len(w))

    z = 0.0

    for i in range(nRBFs):

        # Avoid division by zero
        if r[i] != 0:
            z = z + w[i] * np.exp(-((x - c[i])/r[i])**2)
        else:
            z = z + w[i] * np.exp(-((x - c[i])/(10**-6))**2)

    # Impose limits on harvest effort
    if z < 0:
        z = 0
    elif z > 1:
        z = 1

    return z
To better understand the nature of the harvesting policy, it is helpful to visualize the policy function, .
For some arbitrary selection of RBF parameters:
The following function will plot the harvesting strategy:
def plot_RBF_policy(x_range, x_label, y_range, y_label, RBF_params, nRBFs):
    """
    Parameters:
    -----------
    RBF_params : list [3xnRBFs]
        The RBF parameters in the order of [c, r, w,...,c, r, w].
    nRBFs : int
        The number of RBFs used in the mapping function.

    Returns:
    --------
    None.
    """
    # Step size
    n = 100
    x_min = x_range[0]
    x_max = x_range[1]
    y_min = y_range[0]
    y_max = y_range[1]

    # Generate data
    x_vals = np.linspace(x_min, x_max, n)
    y_vals = np.zeros(n)

    for i in range(n):
        y = evaluate_RBF(x_vals[i], RBF_params, nRBFs)

        # Check that assigned actions are within range
        if y < y_min:
            y = y_min
        elif y > y_max:
            y = y_max

        y_vals[i] = y

    # Plot
    fig, ax = plt.subplots(figsize = (5,5), dpi = 100)
    ax.plot(x_vals, y_vals, label = 'Policy', color = 'green')
    ax.set_xlabel(x_label)
    ax.set_ylabel(y_label)
    ax.set_title('RBF Policy')
    plt.show()
    return
Let’s take a look at the policy that results from the random RBF parameters listed above. Setting my problem-specific inputs, and running the function:
This policy does not make much intuitive sense… why should harvesting efforts be decreased when the fish population is large? Well, that’s because we chose these RBF parameter values randomly.
To demonstrate the flexibility of the RBF functions and the variety of policy functions that can result from them, I generated a few (n = 7) policies using a random sample of parameter values. The parameter values were sampled from a uniform distribution over each parameters range: . Below is a plot of the resulting random policy functions:
Fig: Many random RBF policies, showing flexibility of RBFs.
Finding the sets of RBF parameter values that result in Pareto-optimal harvesting policies is the next step in this process!
Harvest strategy objectives
We take a multi-objective approach to the generation of a harvesting strategy. Given that the populations are vulnerable to collapse, it is important to consider ecological objectives in the problem formulation.
Here, we consider five objectives, described below.
Objective 1: Net present value
The net present value (NPV) is an economic objective corresponding to the amount of fish harvested.
During the simulation-optimization process (later in this post), we simulate a single policy times, and take the average objective score over the range of simulations. This method helps to account for variability in expected outcomes due to natural stochasticity. Here, we use realizations of stochasticity.
With that in mind, the NPV () is calculated as:
where is the discount rate which converts future benefits to present economic value, here .
Objective 2: Prey population deficit
The second objective aims to minimize the average prey population deficit, relative to the prey population carrying capacity, :
Objective 3: Longest duration of consecutive low harvest
In order to maintain steady harvesting levels, we minimize the longest duration of consecutive low harvests. Here, a subjective definition of low harvest is imposed. In a practical decision making process, this threshold may be solicited from the relevant stakeholders.
Objective 3 is defined as:
where
And the low harvest limit is: .
Objective 4: Worst harvest instance
In addition to avoiding long periods of continuously low harvest, the stakeholders have a desire to limit financial risks associated with very low harvests. Here, we minimize the worst 1% of harvest.
The fourth objective is defined as:
Objective 5: Harvest variance
Lastly, policies which result in low harvest variance are more easily implemented, and can limit corresponding variance in fish populations.
The last objective minimizes the harvest variance, with the objective score defined as:
Constraint: Avoid collapse of predator population
During the optimization process, we are able to include constraints on the harvesting policies.
Since population collapse is a stable equilibrium point, from which the population will not regrow, it is imperative to consider policies which prevent collapse.
With this in mind, the policy must not result in any population collapse across the realizations of environmental stochasticity. Mathematically, this is enforced by:
where
Problem formulation
Given the objectives described above, the optimization problem is:
Simulation model of the harvested system
Here, we provide an overview of the fish_game_5_objs() model which combines many of the preceding topics. The goal for this model is to take a set of RBF parameters, which define the harvesting strategy, simulate the policy for some length of time, and then return the objective scores resulting from the policy.
Later, this model will allow for the optimization of the harvesting policy RBF parameters through a Multi-Objective Evolutionary Algorithm (MOEA). The MOEA will evaluate many thousands of policies (RBF parameter combinations) and attempt to find, through evolution, those RBF parameters which yield best objective performance.
A brief summary of the model process is described here, but the curious learner is encouraged to take a deeper look at the code and dissect the process.
The model can be understood as having three major sections:
Initialization of storage vectors, stochastic variables, and assumed ODE parameters.
Simulation of policy and fishery populations over time period T.
Calculation of objective scores.
def fish_game_5_objs(vars):
    """
    Defines the full, 5-objective fish game problem to be solved

    Parameters
    ----------
    vars : list of floats
        Contains the C, R, W values

    Returns
    -------
    objs, cnstr
    """

    # Get chosen strategy
    strategy = 'Previous_Prey'

    # Define variables for RBFs
    nIn = 1 # no. of inputs (depending on selected strategy)
    nOut = 1 # no. of outputs (depending on selected strategy)
    nRBF = 2 # no. of RBFs to use

    nObjs = 5
    nCnstr = 1 # no. of constraints in output

    tSteps = 100 # no. of timesteps to run the fish game on
    N = 100 # Number of realizations of environmental stochasticity

    # Define assumed system parameters
    a = 0.005
    b = 0.5
    c = 0.5
    d = 0.1
    h = 0.1
    K = 2000
    m = 0.7
    sigmaX = 0.004
    sigmaY = 0.004

    # Initialize storage arrays for populations and harvest
    x = np.zeros(tSteps+1) # Prey population
    y = np.zeros(tSteps+1) # Predator population
    z = np.zeros(tSteps+1) # Harvest effort

    # Create array to store harvest for all realizations
    harvest = np.zeros([N,tSteps+1])
    # Create array to store effort for all realizations
    effort = np.zeros([N,tSteps+1])
    # Create array to store prey for all realizations
    prey = np.zeros([N,tSteps+1])
    # Create array to store predator for all realizations
    predator = np.zeros([N,tSteps+1])

    # Create array to store metrics per realization
    NPV = np.zeros(N)
    cons_low_harv = np.zeros(N)
    harv_1st_pc = np.zeros(N)
    variance = np.zeros(N)

    # Create arrays to store objectives and constraints
    objs = [0.0]*nObjs
    cnstr = [0.0]*nCnstr

    # Create array with environmental stochasticity for prey
    epsilon_prey = np.random.normal(0.0, sigmaX, N)

    # Create array with environmental stochasticity for predator
    epsilon_predator = np.random.normal(0.0, sigmaY, N)

    # Go through N possible realizations
    for i in range(N):

        # Initialize populations and values
        x[0] = prey[i,0] = K
        y[0] = predator[i,0] = 250
        z[0] = effort[i,0] = harvest_strategy([x[0]], vars, [[0, K]], [[0, 1]], nIn, nOut, nRBF)
        NPVharvest = harvest[i,0] = effort[i,0]*x[0]

        # Go through all timesteps for prey, predator, and harvest
        for t in range(tSteps):

            # Solve discretized form of ODE at subsequent time step
            if x[t] > 0 and y[t] > 0:
                x[t+1] = (x[t] + b*x[t]*(1-x[t]/K) - (a*x[t]*y[t])/(np.power(y[t],m)+a*h*x[t]) - z[t]*x[t])* np.exp(epsilon_prey[i]) # Prey growth equation
                y[t+1] = (y[t] + c*a*x[t]*y[t]/(np.power(y[t],m)+a*h*x[t]) - d*y[t]) *np.exp(epsilon_predator[i]) # Predator growth equation

                # Solve for harvesting effort at next timestep
                if t <= tSteps-1:
                    if strategy == 'Previous_Prey':
                        input_ranges = [[0, K]] # Prey pop. range to use for normalization
                        output_ranges = [[0, 1]] # Range to de-normalize harvest to
                        z[t+1] = harvest_strategy([x[t]], vars, input_ranges, output_ranges, nIn, nOut, nRBF)

            # Store values in arrays
            prey[i,t+1] = x[t+1]
            predator[i,t+1] = y[t+1]
            effort[i,t+1] = z[t+1]
            harvest[i,t+1] = z[t+1]*x[t+1]
            NPVharvest = NPVharvest + harvest[i,t+1]*(1+0.05)**(-(t+1))

        # Solve for objectives and constraint
        NPV[i] = NPVharvest
        low_hrv = [harvest[i,j]<prey[i,j]/20 for j in range(len(harvest[i,:]))] # Returns a list of True values when there's harvest below 5%
        count = [ sum( 1 for _ in group ) for key, group in itertools.groupby( low_hrv ) if key ] # Counts groups of True values in a row
        if count: # Checks if theres at least one count (if not, np.max won't work on empty list)
            cons_low_harv[i] = np.max(count)  # Finds the largest number of consecutive low harvests
        else:
            cons_low_harv[i] = 0
        harv_1st_pc[i] = np.percentile(harvest[i,:],1)
        variance[i] = np.var(harvest[i,:])

    # Average objectives across N realizations
    objs[0] = -np.mean(NPV) # Mean NPV for all realizations
    objs[1] = np.mean((K-prey)/K) # Mean prey deficit
    objs[2] = np.mean(cons_low_harv) # Mean worst case of consecutive low harvest across realizations
    objs[3] = -np.mean(harv_1st_pc) # Mean 1st percentile of all harvests
    objs[4] = np.mean(variance) # Mean variance of harvest

    cnstr[0] = np.mean((predator < 1).sum(axis=1)) # Mean number of predator extinction days per realization

    # output should be all the objectives, and constraint
    return objs, cnstr
The next section shows how to optimize the harvest policy defined by vars, using the PyBorg MOEA.
A (Very) Brief Overview of PyBorg
PyBorg is the secondary implementation of the Borg MOEA written entirely in Python by David Hadka and Andrew Dircks. It is made possible using functions from the Platypus optimization library, which is a Python evolutionary computing framework.
As PyBorg is Borg’s Python wrapper and thus derived from the original Borg MOEA, it can only be used with permission from its creators. To obtain permission for download, please visit BorgMOEA and complete the web form. You should receive an email with the link to the BitBucket repository shortly.
Installation
The repository you have access to should be named ‘Serial Borg MOEA’ and contain a number of folders, including one called Python/. Within the Python/ folder, you will be able to locate a folder called pyborg. Once you have identified the folder, please follow these next steps carefully:
Check your current Python version. Python 3.5 or later is required to enable PyBorg implementation.
Download the pyborg folder and place it in the folder where this Jupyter Notebook all other Part 1 training material is located.
Install the platypus library. This can be in done via your command line by running one of two options:
Make sure the following training startup files are located within the same folder as this Jupyter Notebook: a) fish_game_functions.py: Contains all function definitions to setup the problem, run the optimization, plot the hypervolume, and conduct random seed analysis. b) Part 1 - Harvest Optimization and MOEA Diagnostics.ipynb: This is the current notebook and where the Fisheries fame will be demonstrated.
We are now ready to proceed!
Optimization of the Fisheries Game
Import all libraries
All functions required for this post can be found in the fish_game_functions.py file. This code is adapted from Antonia Hadjimichael’s original post on exploring the Fisheries Game dynamics using PyBorg.
# import all required libraries
from platypus import Problem, Real, Hypervolume, Generator
from pyborg import BorgMOEA
from fish_game_functions import *
from platypus import Problem, Real, Hypervolume, Generator
from pyborg import BorgMOEA
import time
import random
Formulating the problem
Define number of decision variables, constraints, and specify problem formulation:
# Set the number of decision variables, constraints and performance objectives
nVars = 6   # Define number of decision variables
nObjs = 5   # Define number of objectives
nCnstr = 1      # Define number of decision constraints

# Define the upper and lower bounds of the performance objectives
objs_lower_bounds = [-6000, 0, 0, -250, 0]
objs_upper_bounds = [0, 1, 100, 0, 32000]
Initialize the problem for optimization
We call the fisheries_game_problem_setup.py function to set up the optimization problem. This function returns a PyBorg object called algorithm in this exercise that will be optimized in the next step.
def fisheries_game_problem_setup(nVars, nObjs, nCnstr, pop_size=100):
    """
    Sets up and runs the fisheries game for a given population size

    Parameters
    ----------
    nVars : int
        Number of decision variables.
    nObjs : int
        Number of performance objectives.
    nCnstr : int
        Number of constraints.
    pop_size : int, optional
        Initial population size of the randomly-generated set of solutions.
        The default is 100.

    Returns
    -------
    algorithm : pyBorg object
        The algorthm to optimize with a unique initial population size.

    """
    # Set up the problem
    problem = Problem(nVars, nObjs, nCnstr)
    nVars = 6   # Define number of decision variables
    nObjs = 5   # Define number of objective -- USER DEFINED
    nCnstr = 1      # Define number of decision constraints

    problem = Problem(nVars, nObjs, nCnstr)

    # set bounds for each decision variable
    problem.types[0] = Real(0.0, 1.0)
    problem.types[1] = Real(0.0, 1.0)
    problem.types[2] = Real(0.0, 1.0)
    problem.types[3] = Real(0.0, 1.0)
    problem.types[4] = Real(0.0, 1.0)
    problem.types[5] = Real(0.0, 1.0)

    # all values should be nonzero
    problem.constraints[:] = "==0"

    # set problem function
    if nObjs == 5:
        problem.function = fish_game_5_objs
    else:
        problem.function = fish_game_3_objs

    algorithm = BorgMOEA(problem, epsilons=0.001, population_size=pop_size)
    return algorithm
# initialize the optimization
algorithm = fisheries_game_problem_setup(nVars, nObjs, nCnstr)
Define parameters for optimization
Before optimizing, we have to define our desired population size and number of function evaluations (NFEs). The NFEs correspond to the number of evolutions of the set of solutions. For complex, many-objective problems, it may be necessary for a large NFE.
Here, we start with a small limit on NFE, to test the speed of the optimization. Limiting the optimization to 100 NFE is going to produce relatively poor performing solutions, however it is a good starting point for our diagnostic tests.
init_nfe = 100
init_pop_size = 100
Begin the optimization
In addition to running the optimization, we also time the optimization to get a general estimate on the time the full hypervolume analysis will require.
# begin timing the Borg run
borg_start_time = time.time()

algorithm = fisheries_game_problem_setup(nVars, nObjs, nCnstr, pop_size=int(init_pop_size))
algorithm.run(int(init_nfe))

# end timing and print optimization time
borg_end_time = time.time()

borg_total_time = borg_end_time - borg_start_time

print(f"borg_total_time={borg_total_time}s")
Output: borg_total_time=33.62936472892761s
NOTICE: Running the PyBrog MOEA 100 times took ~34 seconds (on the machine which this was written on…). Keep this in mind, that increasing the NFE will require correspondingly more time. If you increase the number too much, your machine may take a long time to compute the final Pareto-front.
Plot the tradeoff surface
Here, we plot a 3-dimensional plot showing the tradeoff between a select number of objectives. If you have selected the 5-objective problem formulation, you should select the three objectives you would like to analyze the tradeoff surface for. Please select the (abbreviated) objective names from the following list:
Objective 1: Mean NPV Objective 2: Mean prey deficit Objective 3: Mean WCLH Objective 4: Mean 1% harvest Objective 5: Mean harvest variance
# Plot objective tradeoff surface
fig_objs = plt.figure(figsize=(8,8))
ax_objs = fig_objs.add_subplot(111, projection='3d')

# Select the objectives to plot from the list provided in the description above
obj1 = 'Mean NPV'
obj2 = 'Mean prey deficit'
obj3 = 'Mean 1% harvest'

plot_3d_tradeoff(algorithm, ax_objs, nObjs, obj1, obj2, obj3)
Fig: Pareto-approximate solutions generated with 100 function evaluations. The star is an ideal solution.
The objectives scores arn’t very good, but that is because the number of function evaluations is so low. In order to get a better set of solutions, we need to run the MOEA for many function evaluations.
The next section demonstrates the change in objective performance with respect to the number of function evaluations.
MOEA Diagnostics
A good MOEA is assessed by it’s ability to quickly converge to a set of solutions (the Pareto-approximate set) that is also diverse. This means that the final set of solutions is close to the true set, as well as covers a large volume of the multi-dimensional problem space. There are three quantitative metrics via which convergence and diversity are evaluated:
Generational distance approximates the average distance between the true Pareto front and the Pareto-approximate reference set that your MOEA identifies. It is the easiest metric to meet.
Epsilon indicator is a harder metric than generational distance to me et. A high-performing MOEA will have a low epsilon indicator value when the distance of its worst-performing approximate solution from the true Pareto set is small.
Hypervolume measures the ‘volume’ that a Pareto front covers across all dimensions of a problem. It is the hardest metric to meet and the most computationally intensive.
Both the generational distance and epsilon indicator metrics require a reference set, which is the known, true Pareto front. Conversely, the hypervolume does not have such a requirement. Given that the Fisheries Game is a complex, multi-dimensional, many-stakeholder problem with no known solution, the hypervolume metric is thus the most suitable to evaluate the ability of PyBorg to quickly converge to a diverse Pareto-approximate set of solutions.
The hypervolume is a measure of the multi-dimensional volume dominated by the approximated Pareto front. As the Pareto front advances toward the “ideal” solution, this value approaches 1.
The efficiency of an MOEA in optimizing a solution can be considered by measuring the hypervolume with respect to the number of function evaluations. This allows the user to understand how quickly the MOEA is converging to a good set of solutions, and how many function evaluations are needed to achieve a good set of solutions.
Defining hypervolume parameters
First, we define the maximum number of function evaluations (maxevals) and the NFE step size (frequency) for which we would like to evaluate the problem hypervolume over. Try modifying these values to see how the plot changes.
Mind that the value of maxevals should always be more than that of your initial NFE, and that the value of frequency should be less than that of the initial NFE. Both values should be integer values.
Also be mindful that increasing the maxevals > 1000 is going to result in long runtimes.
maxevals = 500
frequency = 100
Plotting the hypervolume
Using these parameters, we then plot the hypervolume graph, showing the change in hypervolume value over the NFEs.
Generally, RSA is performed to track an algorithm’s performance during search. In addition, it is also done to determine if an algorithm has discovered an acceptable approximation of the true Pareto set. More details on RSA can be found here in a blog post by Dave Gold.
For the Fisheries Game, we conduct RSA to determine if PyBorg’s performance is sensitive to the size of its initial population. We do this using the folllowing steps:
Run an ensemble of searches, each starting with a randomly sampled set of initial conditions (aka “random seeds”)
Combine search results across all random seeds to generate a “reference set” that contains only the best non-dominated solutions across the ensemble
Repeat steps 1 and 2 for an initial population size of 200, 400, etc.
pop_size_list = [100, 200, 400, 800, 1000]

fig_rand_seed = plt.figure(figsize=(10,7))
ax_rand_seed = fig_rand_seed.add_subplot()

for p in range(len(pop_size_list)):
    fisheries_game_problem_setup(nVars, nObjs, nCnstr, pop_size_list[p])
    algorithm = fisheries_game_problem_setup(nVars, nObjs, nCnstr, pop_size=int(init_pop_size))
    algorithm.run(int(init_nfe))

    plot_hvol(algorithm, maxevals, frequency, objs_lower_bounds, objs_upper_bounds,
              ax_rand_seed, pop_size_list[p])

plt.title('PyBorg Random Seed Analysis')
plt.xlabel('Number of Function Evaluations')
plt.ylabel('Hypervolume')
plt.legend()
plt.show()
Notice that the runs performed with different initial population sizes tend to converge toward a similar hypervolume value after 500 NFEs.
This reveals that the PyBorg MOEA is not very sensitive to the specific initial parameters; it is adaptable enough to succeed under different configurations.
Conclusion
A classic decision-making idiom says ‘defining the problem is the problem’. Hopefully, this post has revealed that to be true; we have shown that changes to the harvesting strategy functions, simulation model, or objective scores can result in changes to the resulting outcomes.
And if you’ve made it this far, congratulations! Take a minute to think back on the progression of this post: we revisited the harvested predator-prey model, formulated the harvesting policy using RBFs, and formulated the policy objectives and its associated simulation model. Next, we optimized the harvesting policy using the PyBorg MOEA and performed basic MOEA diagnostics using hypervolume as our measure, and executed random seed analysis.
If you’ve progressed through this tutorial using the Jupyter Notebook, we encourage you to re-visit the source code involved in this process. The next advisable step is to re-produce this problem from scratch, as this is the best way to develop a detailed understanding of the process.
Next time, we will explore the outcomes of this optimization, by considering the tradeoffs present across the Pareto set of solutions.
Cython is an extension of the Python programming language that allows you to add C-like functionality, such as static typing and compilation. This can lead to significant efficiency gains over pure Python. In my last blog post, I introduced Cython’s motivation and benefits using a simple Fibonacci sequence example. Cythonizing this program led to a 20-30x speedup on my laptop, for very little work!
However, you may be wondering about the feasibility and impact of Cython for more complex programs, such as simulation models used in research. In this blog post, I will demonstrate how Cython can be applied to larger, object-oriented programs that use functions, classes, and NumPy arrays, using a reservoir simulation model as an example. Readers unfamiliar with Cython are encouraged to read the first post in this series prior to proceeding.
Reservoir simulation model
All code used in this blog post can be found in this GitHub repository, in the reservoir_sim directory. This contains nine sub-directories with different versions of the model. I will describe the differences between the versions later in this post, but first I will briefly introduce the major components of the simulation model using the py_fast version. The model simulates a two-reservoir system, one of which is downstream from the other. Both have their own inflows, which are sinusoidal plus noise. Additionally, both reservoirs have their own demands and minimum flow thresholds, which are also sinusoidal plus noise. Each time step, the upper reservoir attempts to release the minimum flow requirement if there is enough water, then tries to satisfy the demand if possible. The lower reservoir then repeats the same process, with the upper reservoir’s releases added to its own catchment inflows. The simulation is run over a number of years, and the stochastic inputs (inflows, upstream releases, minimum flow requirements, demand) and outputs (releases, deliveries, storages) are stored as time series.
The directory py_fast contains three Python files, representing the Demand, Reservoir, and Model classes. The simplest class, Demand, is initialized with inputs that determine the parameterization of the random demand process, and a function that can be called each day to randomly sample from this process:
### Demand class - pure Python
from random import gauss
from math import pi, sin

class Demand():
  def __init__(self, name, demand_params):
    self.name = name
    # amplitude, phase, shift, & noise std for sine wave of demands
    self.demand_amp, self.demand_phase, self.demand_shift, self.demand_noise = demand_params
    # save 2pi/365 to save conversion time
    self.days_to_radians = 2. * pi / 365.

  ### demand function
  def demand_t(self, t):
    noise = gauss(0., self.demand_noise)
    demand_t = self.demand_amp * sin((t - self.demand_phase)  * self.days_to_radians) + self.demand_shift + noise
    return demand_t
The Reservoir class is similar, with parameter initialization and its own stochastic inflow and minimum flow sampling methods. The initialization also instantiates a Demand object belonging to the Reservoir object.
### Reservoir class - pure Python
import numpy as np
from Demand import Demand

class Reservoir():
  def __init__(self, name, inflow_params, min_flow_params, demand_params, storage_params):
    self.name = name
    # amplitude, phase, shift, & noise std for sine wave of inflows
    self.inflow_amp, self.inflow_phase, self.inflow_shift, self.inflow_noise = inflow_params
    # amplitude, phase, and shift for sine wave of minimum flows
    self.min_flow_amp, self.min_flow_phase, self.min_flow_shift = min_flow_params
    # reservoir capacity and initial storage
    self.capacity, self.storage = storage_params
    # set up demand object
    self.demand = Demand(name, demand_params)

  ### inflow function
  def inflow_t(self, t):
    noise = np.random.normal(0., self.inflow_noise, 1)[0]
    inflow_t = self.inflow_amp * np.sin((t - self.inflow_phase)  * 2. * np.pi / 365.) + self.inflow_shift + noise
    return inflow_t

  ### min flow function
  def min_flow_t(self, t):
    min_flow_t = self.min_flow_amp * np.sin((t - self.min_flow_phase)  * 2. * np.pi / 365.) + self.min_flow_shift
    return min_flow_t
The Reservoir class also has a step method, which dictates the release, delivery, and updated storage based on the availability of water.
  ### step reservoir another day
  def step(self, t, upstream_release):
    inflow = self.inflow_t(t)
    min_flow = self.min_flow_t(t)
    demand = self.demand.demand_t(t)

    # first assume release & delivery meet min_flow and demand exactly
    release = min_flow
    delivery = demand
    self.storage += inflow + upstream_release - release - demand

    # check if storage overflow
    if self.storage > self.capacity:
      release += self.storage - self.capacity
      self.storage = self.capacity

    # check if storage went negative. if so, curtail demand first, then env flows
    elif self.storage < 0:
      if delivery > (-self.storage):
        delivery += self.storage
        self.storage = 0.
      else:
        self.storage += delivery
        delivery = 0
        if release > (-self.storage):
          release += self.storage
          self.storage = 0
        else:
          print('This should not be happening')

    return (inflow, upstream_release, min_flow, demand, release, delivery, self.storage)
Finally, the Model class is used to set up and run the simulation. Upon initialization, the Model object first creates the upper and lower Reservoir objects, and creates a dictionary of lists to hold the results.
### Model class for running simulation
import matplotlib.pyplot as plt
import random
import numpy as np
from Reservoir import Reservoir

class Model():
  def __init__(self, years, plot, seed):
    # length of simulation (no leap years)
    self.years = years
    self.days = 365 * self.years
    # boolean for whether to plot
    self.plot = plot
    # random seed
    random.seed(seed)

    ### set up upper reservoir
    # inflow params in terms of sinusoid, (amplitude, phase, shift, noise). units = AF/day
    inflow_params = (300., 0., 500., 20.)
    # min flow params in terms of sinusoid, (amplitude, phase, shift). units = AF/day
    min_flow_params = (200., 122., 300.)
    # demand params in terms of sinusoid, (amplitude, phase, shift, noise). units = AF/day
    demand_params = (300., 163., 600., 30.)
    # storage params (capacity, starting storage). units = AF
    storage_params = (500000., 250000.)
    # initialize upper reservoir
    self.reservoir_upper = Reservoir('upper', inflow_params, min_flow_params, demand_params, storage_params)

    ### set up lower reservoir
    # inflow params in terms of sinusoid, (amplitude, phase, shift, noise). units = AF/day
    inflow_params = (200., 30., 600., 100.)
    # min flow params in terms of sinusoid, (amplitude, phase, shift). units = AF/day
    min_flow_params = (100., 91., 400.)
    # demand params in terms of sinusoid, (amplitude, phase, shift, noise). units = AF/day
    demand_params = (100., 152., 300., 10.)
    # storage params (capacity, starting storage). units = AF
    storage_params = (20000., 15000.)
    # initialize lower reservoir
    self.reservoir_lower = Reservoir('lower', inflow_params, min_flow_params, demand_params, storage_params)

    ### set up data storage
    self.reservoir_list = [self.reservoir_upper, self.reservoir_lower]
    self.output = {}
    for reservoir in self.reservoir_list:
      self.output[reservoir.name] = {}
      self.output[reservoir.name]['inflow'] = []
      self.output[reservoir.name]['upstream_release'] = []
      self.output[reservoir.name]['min_flow'] = []
      self.output[reservoir.name]['demand'] = []
      self.output[reservoir.name]['release'] = []
      self.output[reservoir.name]['delivery'] = []
      self.output[reservoir.name]['storage'] = [reservoir.storage]
The Model.run function performs the simulation loop.
  def run(self):
    for t in range(self.days):
      # step upper
      (inflow, upstream_release, min_flow, demand, release, delivery, storage) = self.reservoir_upper.step(t, 0.)
      self.output['upper']['inflow'].append(inflow)
      self.output['upper']['upstream_release'].append(upstream_release)
      self.output['upper']['min_flow'].append(min_flow)
      self.output['upper']['demand'].append(demand)
      self.output['upper']['release'].append(release)
      self.output['upper']['delivery'].append(delivery)
      self.output['upper']['storage'].append(storage)

      (inflow, upstream_release, min_flow, demand, release, delivery, storage) = self.reservoir_lower.step(t, release)
      self.output['lower']['inflow'].append(inflow)
      self.output['lower']['upstream_release'].append(upstream_release)
      self.output['lower']['min_flow'].append(min_flow)
      self.output['lower']['demand'].append(demand)
      self.output['lower']['release'].append(release)
      self.output['lower']['delivery'].append(delivery)
      self.output['lower']['storage'].append(storage)

    # return total storage last time step to make sure versions are equivalent
    return self.output['upper']['storage'][-1] + self.output['lower']['storage'][-1]
We can run the model and plot the results as follows (plot function not shown for brevity, see repository).
from Model import Model

# initialize model
model = Model(years = 5, plot = True, seed = 101)

# run simulation
tot_storage = model.run()

# plot results
model.plot_results()
Figure 1: Five-year realization of simulated inflows with and without upstream release (column 1), demand vs. deliveries (column 2), minimum flow requirement vs. release (column 3), and storage (column 4) for the upper (row 1) and lower (row 2) reservoirs.
Cythonizing a class
Now that we have our model in place, we can begin to add static type information and Cythonize it. I will focus now on the cy version of the model, which builds on the py_fast model. First consider Demand.pyx.
### Demand class - cython
from random import gauss
from math import pi, sin

cdef class Demand():
  def __init__(self, name, demand_params):
    self.name = name
    # amplitude, phase, shift, & noise std for sine wave of demands
    self.demand_amp, self.demand_phase, self.demand_shift, self.demand_noise = demand_params
    # save 2pi/365 as double to save conversion time
    self.days_to_radians = 2. * pi / 365.

  ### demand function
  cdef double demand_t(self, double t):
    cdef double noise, demand_t, sin_t

    noise = gauss(0., self.demand_noise)
    sin_t = sin((t - self.demand_phase) * self.days_to_radians)
    demand_t = self.demand_amp * sin_t + self.demand_shift + noise
    return demand_t
This is similar to Demand.py in the Python version, other than a few main differences. Cython classes are defined with “cdef” rather than “def”. Within a class, we can also define its methods using the cdef keyword. Similar to the Fibonacci sequence example in my earlier blog post, we provide type information for the return value and arguments in the function definition for demand_t(). Lastly, we can provide type information for any variables used within the function, such as noise, again using the cdef signifier.
It is not necessary to provide this information for every variable and function. For example, the __init__ function in general cannot be defined with cdef. However, the more type information you can provide, the more Cython will be able to speed up your code. Inspecting the annotated html that Cython outputs (see the first post in this series), as well as code profiling (see this blog post by Antonia Hadjimichael), can help to figure out which variables and methods are the most important bottlenecks to speed up, and which have diminishing marginal returns and can be left as untyped Python variables/methods.
You may have noticed that I did not provide static type information for class attributes (e.g., self.name, self.demand_amp). These variables are defined and typed in a separate file, Demand.pxd.
cdef class Demand():

  cdef:
    public str name

    public double demand_amp, demand_phase, demand_shift, demand_noise, days_to_radians

  cdef double demand_t(self, double t)
A .pxd “definition file” is the Cython equivalent of a header file in C; it defines attributes and methods of the class and gives type information. Any class that has a definition file will create a C extension type. Variables and methods in the definition file can only be accessed by other Cython scripts, rather than pure Python code. Cython also has a third kind of function definition, “cpdef”, which can be called from either Cython or Python. This can be useful if your application needs to be interoperable with Cython and Python, but will not perform as efficiently as cdef methods.
One important thing to notice is that each variable belonging to the class should be preceded by “public” if we want the attribute to be accessible to other objects. Also note that only cdef-defined functions should be included here, rather than pure Python functions.
The Reservoir class is Cythonized in a similar way, and the interested reader is referred to the GitHub repository to see the changes in detail. Moving to the Model class, there are several important differences to note in the .pxd file.
from Reservoir cimport Reservoir

cdef class Model():

  cdef:
    public int years, days

    public double tot_storage

    public bint plot

    public list reservoir_list

    public dict output

    public Reservoir reservoir_upper, reservoir_lower

  cdef double run(self) except *
First, notice that the Reservoir class is imported with the cimport command (“Cython import”) rather than import, since it is now an extension type. This should be done in both the .pyx and .pxd files. Second, I have included “except *” after the parentheses in the definition of the run() method. This instructs our compiled C code to pass exceptions through to the Python runtime. Otherwise, the program will try to treat errors as warnings and keep running, which makes it challenging to debug and verify behavior. This should be included in both the .pyx and .pxd files. Third, bint is the C equivalent of the bool type in Python.
The last important change in the Cython version is the inclusion of a new file, main.pyx. As noted previously, Cython extension types can only be imported using cimport from Cython, rather than pure Python code. For this reason, we can no longer directly import and run the Model class as we did in the pure Python implementation above. Instead, main.pyx is used as a go-between. This script is Cythonized (note the .pyx ending), but is not an extension type since it does not include a definition file (.pxd) with cythonized methods or attributes. Thus the file is allowed to import extension types (since it is a Cython file), while also remaining importable itself into pure Python (since it is not an extension type).
from Model cimport Model

cdef class main():
  cdef public Model model

  def __init__(self, int years, bint plot, int seed):
    # initialize model
    self.model = Model(years = years, plot = plot, seed = seed)

    # run simulation
    self.model.tot_storage = self.model.run()

    # plot results
    if self.model.plot:
      self.model.plot_results()
The main class can now be imported in pure Python to run the simulation, in much the same way as we imported and ran the Model class before.
from main import main

# run model
main_obj = main(years = 5, plot = True, seed = 101)

# verify that final storage is the same
print(main_obj.model.tot_storage)
For both py_fast and cy versions, we can verify that the final storage at the end of five years is 12,066. However, as we shall see later in this post, the Cythonized version completes the procedure more quickly.
NumPy and Memory Views
Most scientific programs rely heavily on NumPy arrays for numeric computation. For example, the py_numpy version of the Model class stores time series outputs in a NumPy array rather than nested dictionaries and lists. This output array is initialized in the class constructor, and then populated with outputs as the model is run (compare this to the original Python version above).
class Model():
  def __init__(self, years, plot, seed):

    ...

    self.output = np.empty((num_reservoirs * self.num_step_outputs, self.days + 1))
    for i in range(len(reservoir_list)):
      self.output[i * self.num_step_outputs + self.num_step_outputs - 1, 0] = reservoir_list[i].storage


  def run(self):
    for t in range(1, self.days + 1):
      t_run = t - 1

      ### step upper
      self.output[:7, t] = self.reservoir_upper.step(t_run, 0.)

      ### step lower, using upper release as inflow
      self.output[7:, t] = self.reservoir_lower.step(t_run, self.output[4, t])

    # return total storage last time step to make sure versions are equivalent
    return self.output[6, -1] + self.output[-1, -1]
Because a NumPy array is not a native Python type (e.g., float, list), it cannot be used as a static type for Cython (i.e., we can’t simply define an array arr with “cdef np.array arr“). However, we can use “memoryviews,” which are a more general form of typed memory buffer than NumPy (and are, in fact, what NumPy is based on). The nuances of memoryviews can be a bit challenging, and a full explanation is beyond the scope of this post. But I will give a simple example usage for Cython, and the interested reader is referred to the docs here and here for more information.
Memoryviews are created by designating the type of variable to go inside the array (e.g., double), followed by square brackets with colons and commas dictating the number of dimensions. For example, in the cython_numpy version of Model.pxd, we define the 2-dimensional memory view to store results as follows:
cdef class Model():

  cdef:

    ...

    public double[:,:] output
Now in the model constructor, we initialize the memory view as follows:
    output_np = np.empty((num_reservoirs * self.num_step_outputs, self.days + 1))
    self.output = output_np

    for i in range(len(reservoir_list)):
      self.output[i * self.num_step_outputs + self.num_step_outputs - 1, 0] = reservoir_list[i].storage
The only difference from the Pythonic implementation is that we have to split the creation of the memoryview into two steps; first we create a NumPy array (output_np), then we set the memoryview (np.output) to correspond to the block of memory holding output_np. Once we have created the memoryview, we can access and reassign values using standard NumPy syntax. For example, here is the part of the Model.run() function that steps the upper reservoir.
Again, this has to be split into two steps; first call the reservoir’s step function and receive the output as a tuple of variables, and then reset each value in the memoryview using this data. We cannot simply set the entire slice self.output[:7, t] directly using the tuple returned by the function, like we did in python_numpy, because Cython is expecting an array rather than a tuple. It is possible to convert the tuple into a NumPy array and then reassign the slice using this NumPy array, but this was found to be less efficient when I timed different versions. Alternatively, we can alter the definition of Reservoir.step() to return a memoryview rather than a tuple, which allows the Model class to reassign values in the memoryview directly from the function call. However, this too was found to be less efficient, as we will see in the next section. The interested reader is referred to the cy_numpy_reservoir version of the model for implementation details.
Testing the performance of different versions
Now that I have described how to Cythonize your classes and NumPy arrays, you may be wondering, “Ok, but was it worth it? How much does this speed up the code?” We can answer this question with a timing experiment. The reservoir_sim directory in the GitHub repository contains nine versions of the code, summarized as follows:
py_slow: My first attempt at creating the example reservoir simulation model in Python, which contains several bottlenecks.
py_fast: An improved Python-only model after eliminating bottlenecks, used as a baseline for improvement.
py_numpy: Python-only version that uses a NumPy array to store the time series of results.
py_numpy_reservoir: Python-only version that uses NumPy arrays to store results inside the daily time step as well.
py_cy: A copy of py_fast, which is then Cythonized without explicitly adding static type information.
cy: Updates to py_fast to add static type information.
cy_numpy: Similar to py_numpy, but Cythonized with static types and memory views.
cy_numpy_reservoir: Similar to py_numpy_reservoir, but Cythonized with static types and memory views.
cy_numpy_noCheck: Copy of cy_numpy, with the additional step of disabling Python’s automatic bounds checking and index wrapping.
This directory also includes two scripts: time_versions.sh will first Cythonize all the Cython versions of the model, and then run a timing experiment with all versions, using the script time_sim.py. The experiment will output the relative efficiency of each version, averaged over 4 trials of 20 simulations, each of which is 50 years long.
Starting timings

py_slow: answer = 10494.223405436973, time = 1.1308925539487973, efficiency  = 1.0

py_fast: answer = 9851.320332349133, time = 0.26572948903776705, efficiency relative to py_slow = 4.25580374253483

py_numpy: answer = 9851.320332349133, time = 0.3013913669856265, efficiency relative to py_fast = 0.8816758479032341

py_numpy_reservoir: answer = 9851.320332349133, time = 0.38436312798876315, efficiency relative to py_fast = 0.6913501053762255

py_cy: answer = 9851.320332349133, time = 0.23376567207742482, efficiency relative to py_fast = 1.1367344344286598

cy: answer = 9851.320332349133, time = 0.13966371200513095, efficiency relative to py_fast = 1.9026380240273488

cy_numpy: answer = 9851.320332349133, time = 0.09388123091775924, efficiency relative to py_fast = 2.8304857791068843

cy_numpy_reservoir: answer = 9851.320332349133, time = 0.22499373101163656, efficiency relative to py_fast = 1.181052857975068

cy_numpy_noCheck: answer = 9851.320332349133, time = 0.09497074002865702, efficiency relative to py_fast = 2.7980143037485474
Here are the major takeaways from comparing the speedups across versions:
Make sure your Python code is optimized prior to using Cython. py_slow was 4.3x more efficient than py_fast. The only major difference between these is that in the former, I used the numpy.random module to generate stochastic realizations each day, whereas in the latter I used the basic random module. This small change led to significant gains due to avoiding the extra overhead of the NumPy generator (this is also why these versions got different answers, due to different random number generators). The point here is that major gains can often be made with very little work by finding and eliminating bottlenecks. As mentioned above, code profiling can be extremely helpful to make sure that you have eliminated major bottlenecks prior to implementing larger changes in Cython. Note that py_fast is used as the baseline comparison for all other versions, rather than py_slow. (For any of you thinking I should have just used NumPy to pre-generate an entire array of random numbers rather than generating them one-by-one each day – yes you are right, that would have probably been faster. But I set it up like this to provide a more challenging example of an object-oriented model with function calls between nested objects).
NumPy arrays are not always faster. Like many scientists/engineers, I tend to rely on NumPy a lot, both due to their convenience and due to the fact that they are often praised for speed (NumPy is largely written in C, after all). However, in some cases this can actually degrade performance due to the larger overhead of creating NumPy arrays relative to lists. The py_numpy version that uses NumPy to hold the results was actually 12% less efficient than the baseline version using nested dictionaries and lists. Moreover, py_numpy_reservoir, which uses a new NumPy array to store results for each reservoir each day, is 31% slower than baseline. This is not to say NumPy arrays can’t be beneficial – they are extremely fast at vectorized numerical operations. But for situations with smaller arrays and/or minimal opportunity for vectorized computation, they may not be worth the overhead.
Cythonizing Python code can improve performance. The py_cy version, which does not include static type information and is identical to py_fast except for the Cythonization, leads to a 20% efficiency gain. This is not huge, but could be meaningful and requires little extra work. Meanwhile, the cy version with statically typed Cython extension types has a larger efficiency gain of 90%.
Cython and NumPy can be synergisticif used properly. The cy_numpy version further improves performance, with an efficiency of 2.8 relative to py_fast. Interestingly, this version is identical to py_numpy other than the Cython-related changes, but is found to lead to significant gains whereas the former leads to degraded performance. Cython and memoryviews allow us to interface more directly with NumPy’s underlying C code, reducing the Python-related overhead. However, this is not universally true – cy_numpy_reservoir is found to degrade performance significantly relative to the other Cythonized versions, suggesting that the creation of NumPy arrays within the inner daily step routine is not worth the overhead.
Disabling certain Python features may not be worthwhile. The last version, cy_numpy_noCheck, builds on cy_numpy by adding two compiler directives to model.run(): @boundscheck(False) and @wraparound(False). The first tells Cython to disable Python’s automatic bounds checking for lists, tuples, etc., while the second disables the ability to count backwards when indexing (e.g., arr[-3:]). These directives are meant to allow for further efficiency gains by reducing the Pythonic overhead. However, in this particular case, it isn’t found to have a meaningful impact. Since these directives can lead to mysterious bugs for users accustomed to Python syntax, they should be used with caution, and only after verifying that they actually create efficiency gains that are worth the risk.
Overall, Cython is found to improve the efficiency of this reservoir simulation model by 2-3x on my laptop. Unfortunately, this is much lower than the 20-30x speedups observed for the Fibonacci sequence example in the last blog post. This is due to the more complex operations and object-oriented structure of the simulation model, which leads to more interactions with the Python interpreter compared to the tight numerical loop of the Fibonacci generator. However, a 2-3x efficiency gain can still be very meaningful, especially in situations involving large ensembles of expensive simulations in parallel computing environments. In general, the potential gain from Cython, and whether or not this is worth the trouble, will depend on factors such as the structure of the model, its runtime, and the skill level of model developers and users.
Further reading
If this blog post has piqued your interest and you want to apply Cython to your own research, you might try looking through more advanced water resources simulation models that make use of Cython, such as Pywr or the California Food-Energy-Water System (CALFEWS).
For more general information, of course see the Cython docs. I also highly recommend Kurt W. Smith’s O’Reilly Media book, “Cython: A Guide for Python Programmers” for those wanting a deeper understanding. It also looks like the author also has a tutorial, but I haven’t tried it yet. Lastly, for information on how to improve the efficiency of your Python code more generally (prior to or in lieu of using Cython), I recommend Micha Gorelick and Ian Ozsvald’s O’Reilly Media book, “High Performance Python: Practical Performant Programming for Humans.”


 . This system of equations is defined in
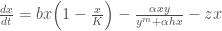

 is the prey population being harvested and
  is the predator population. Please refer to
 , rather than specific parameter values,
 ![z = [z_1, z_2, ..., z_t]](https://s0.wp.com/latex.php?latex=z+%3D+%5Bz_1%2C+z_2%2C+...%2C+z_t%5D&bg=ffffff&fg=444444&s=0&c=20201002) . The process of optimizing the parameters of a state-aware control rule is known as Direct Policy Search (DPS; Quinn et al, 2017).
. The process of optimizing the parameters of a state-aware control rule is known as Direct Policy Search (DPS; Quinn et al, 2017). , is mapped to the current prey population levels,
  by the function:
![z_{t+1} = \sum_{i=1}^n w_i \Big[exp\Big[-\Big(\frac{x_t-c_i}{b_i}\Big)^2\Big]\Big]](https://s0.wp.com/latex.php?latex=z_%7Bt%2B1%7D+%3D+%5Csum_%7Bi%3D1%7D%5En+w_i+%5CBig%5Bexp%5CBig%5B-%5CBig%28%5Cfrac%7Bx_t-c_i%7D%7Bb_i%7D%5CBig%29%5E2%5CBig%5D%5CBig%5D&bg=ffffff&fg=444444&s=0&c=20201002)
 and
and  are the center, radius, and weights of each RBF
  respectively. Additionally,
  is the number of RBFs used in the function; in this study we use
  RBFs. With two RBFs, there are a total of 6 parameters. Increasing the number of RBFs allows for more flexible function forms to be achieved. However, two RBFs have been shown to be sufficient for this problem.
![[c_1, b_1, w_1, c_2, b_2, w_2]](https://s0.wp.com/latex.php?latex=%5Bc_1%2C+b_1%2C+w_1%2C+c_2%2C+b_2%2C+w_2%5D&bg=ffffff&fg=444444&s=0&c=20201002) ), and the current prey population, to calculate the next year’s harvesting effort.
), and the current prey population, to calculate the next year’s harvesting effort. .
.![[c_1, b_1, w_1, c_2, b_2, w_2] = [0.2, 1.1, 0.41, 0.34,0.7, 0.59]](https://s0.wp.com/latex.php?latex=%5Bc_1%2C+b_1%2C+w_1%2C+c_2%2C+b_2%2C+w_2%5D+%3D+%5B0.2%2C+1.1%2C+0.41%2C+0.34%2C0.7%2C+0.59%5D+&bg=ffffff&fg=444444&s=0&c=20201002)

![c_i, b_i, w_i \in [0,1]](https://s0.wp.com/latex.php?latex=c_i%2C+b_i%2C+w_i+%5Cin+%5B0%2C1%5D&bg=ffffff&fg=444444&s=0&c=20201002) . Below is a plot of the resulting random policy functions:
. Below is a plot of the resulting random policy functions: times, and take the average objective score over the range of simulations. This method helps to account for variability in expected outcomes due to natural stochasticity. Here, we use
  realizations of stochasticity.
 ) is calculated as:
 is the discount rate which converts future benefits to present economic value, here
  .
. :
: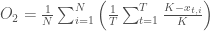


 .
.