
I’m very excited to write this blogpost to highlight the GRRIEn framework that was developed in part by Dr. Elizabeth Carter at Syracuse University, along with collaborators Carolynne Hultquist and Tao Wen. I first saw Liz present the GRRIEn framework at the Frontiers in Hydrology conference last year and I knew it was a framework that I wanted to eventually demo on the blog. The associated manuscript (now published here) that introduces the GRRIEn (Generalizable, Reproducible, Robust, and Interpreted Environmental) framework is a cheat sheet of best management practices to extract generalizable insight on environmental systems using supervised learning of global environmental observations (EOs; satellites and coupled earth systems models), including standards for reproducible data engineering, robust model training, and domain-specialist interpreted model diagnostics (Carter et al., 2023).
In short, this is a paper that I wish existed when I first started diving into data science and machine learning in graduate school. If you are a student/have a student who is new to statistics, data science, and machine learning for environmental applications, I highly recommend this paper as the single most useful one-stop shop read. Below, I will introduce a bit about Liz and her group, the steps of the framework, and include some of the awesome ways that Liz has incorporated GRRIEn into her classes.
The CHaRTS Lab
Dr. Carter is based at Syracuse University and runs the Climate Hazards Research Team Syracuse (CHaRTS). CHaRTS uses proxy observations of the hydrologic cycle from satellites, photographs, and earth systems models to support fair and stable management of water resources and hydroclimatic risk in the twenty-first century. I talked to Liz about creating the GRRIEn framework and the results that she has seen in the classroom.

Why did you decide to create GRRIen?
“GRRIEn was created as a teaching tool for my graduate class, Environmental Data Science (EDS). EDS was intended to equip students with the computation tools they would need to use global earth observations for thesis/dissertation research. Some of my students have an interest in spatial statistics and machine learning, but most of them are domain specialists who want to use global earth observations to learn more about very specific environmental processes. The GRRIEn method was created for these students, the domain specialists. The goal is to reduce barriers to accessing insight from global earth observations associated with computational methods and advanced statistical techniques. For example, many students struggle to find and process spatial data. In EDS, they adopt a standard reproducible computational pipeline in the form of a GitHub repository for accessing raw data and creation of an analysis-ready dataset. For students who have limited statistical skills, I teach a few simple model-agnostic tools to diagnose and control for feature and observation dependence in multivariate observational spatiotemporal datasets. Most importantly, I teach methods in model interpretation. We need domain specialists to evaluate whether data-driven models are a physically plausible representation of environmental processes if we want to use global earth observations for knowledge discovery.”
What kind of results have you seen as you incorporate GRRIen in the classroom?
“My favorite part of EDS is seeing students going from never having written a line of code to processing massive volumes of data. Because so much of the process has been constrained by the GRRIEn method, students can really spread their wings in terms of application. For the past three years, I’ve had several students take their EDS project to conferences like AGU, or submit it for publication.”
Overview of the GRRIEn Framework
As the volume of earth observations from satellites, global models, and the environmental IoT continues to grow, so does the potential of these observations to help scientists discover trends and patterns in environmental systems at large spatial scales. Because many emerging global datasets are too large to store and process on personal computers, and because of scale-dependent qualities of spatial processes that can reduce the robustness of traditional statistical methods, domain specialists need targeted and accessible exposure to skills in reproducible scientific computing and spatial statistics to allow the use of global observations from satellites, earth systems models, and the environmental IoT to generalize insights from in-situ field observations across unsampled times and locations. The GRRIEn framework (which stands for generalizable, robust, reproducible, and interpretable environmental analytic framework) was developed for this purpose (Carter al., 2023). Below are the four key components of the framework, but please refer to the manuscript for full descriptions and examples.
Generalizable: How well do your experimental results from a sample extend to the population as a whole?

A primary motivation to generate global EOs is to allow scientists to translate insight from our limited field measurements to unsampled times and locations to improve the generalizability of our earth systems theories. As global EOs are (approximately) spatiotemporally continuous observations, the overall objective of GRRIEn analysis is to train a supervised learning algorithm that can predict an environmental process using globally available EOs as input data. This algorithm can be used to generalize insights from direct observations of an environmental process sampled experimentally or in-situ across unlabeled times or locations where global EOs are available (i.e. through interpolation, extrapolation, and diagnostic modeling)
Robust: Do your statistics show good performance on data drawn from a wide range of probability and joint probability distributions?
In order for your model to generalize well, you must quantify and account for scale-dependent multicollinearity and spatial/temporal dependence in your data. For example, multicollinearity occurs when one or more predictor variables are linearly related to each other. It is a problem for prediction and inference because the accuracy of predictions depends on the exact structure of multicollinearity that was present in the training dataset being present in the prediction dataset. Since it is associated with model instability in most machine learning and some deep learning applications, it also impacts diagnostic modeling; the model is less likely to interpret the system in a physically plausible way, and small changes in training data can lead to big changes in model weights and parameters.
Furthermore, correlation structure tends to be dynamic in space and time. The figure below shows an example of correlation structure between summertime air temperature and precipitation from 1950-2000 (left) and projected from 2050-2100 (right). One can see that the correlation between air temperature and precipitation will change for many locations in the US under climate change. This suggests that statistical models trained using temperature and precipitation under 20th century conditions will not make robust estimates in the 21st century.

2009)] between bias-corrected statistically downscaled Climate Model Intercomparison
Project 5 ensemble mean monthly precipitation and daily max temperature. Historical
observations 1950-1999 (left) and moderate emissions forecast (RCP 4.5) for 2050-2099 (right) both indicate spatiotemporal variability collinearity between summertime maximum temperature and precipitation. Covariance of meteorological variables is a signature of local climate. As local climates shift due to global warming, so will the local covariability of meteorological variables (right). This generates complexity for predicting environmental process response to meteorological variables under climate change (Taylor et al. 2012)
We can’t expect to collect a sample of future covariability structure because these conditions haven’t happened yet. So how do we address these issues? The manuscript summarizes a great checklist of steps to make sure your model development is robust to both dependent features and observations.

features (left) and observations (right) in spatiotemporal systems.
Reproducible: Can other scientists understand and replicate your analysis and yield the same results?
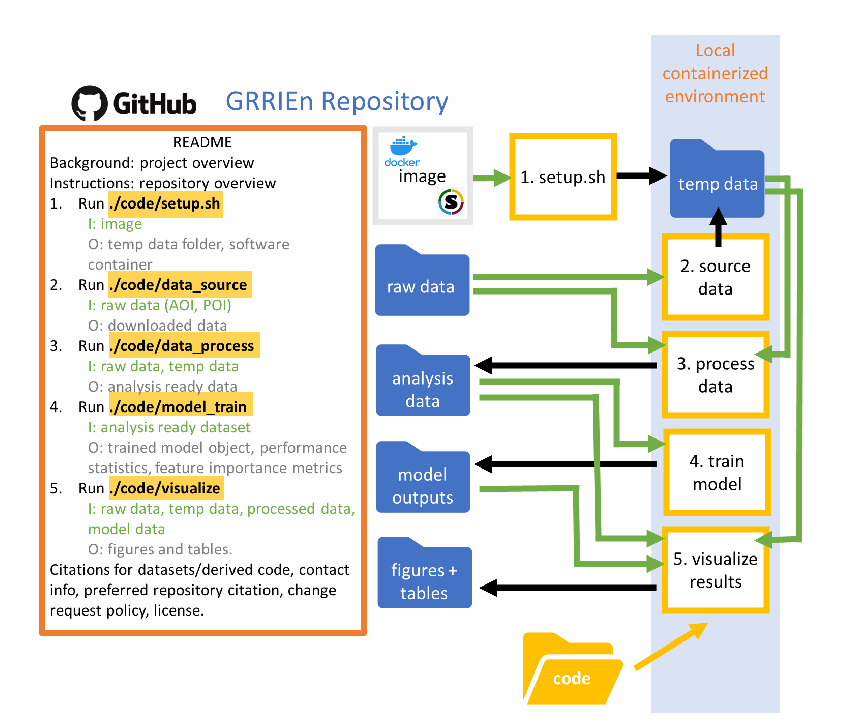
The best way to facilitate this is to create a clear repository structure which contains a README, a container image that has specified versions of all packages that are used, and code that facilitates both the download of larger geospatial datasets that can’t be stored in a repository and code to reproduce analyses and figures.
In Liz’s Environmental Data Science class at Syracuse (CEE 609), she has her students complete a semester long project where every piece of the project is documented in a GRRIEn repository structure (see here for a great example). By the end of the semester, she noted that her students have a written paper, fully documented workflow, and a populated repository that often has served as a basis for a journal publication for students in her research group.
Interpretable: Do your model parameters reflect a physically plausible diagnosis of the system?
The most important step to ensuring that your model will make the right predictions in different contexts is to make sure those predictions are happening for the right reason: have your model weights and parameters diagnosed the importance of your predictors, and their relationship to the environmental process that serves as your predictand, in a physically plausible way? The authors suggest forming a set of interpretable hypotheses before modeling that denotes the data that you are using and the relationships you expect to find and then utilizing local and global interpretation methods to confirm or reject the original hypotheses.
Conclusion/Resources
I think the GRRIEn framework is a really great tool for young researchers embarking on data science and machine learning projects. If you are a newer faculty that is interested in incorporating some of these concepts into your class, Liz has made “Code Sprints” from her class available here. There are Jupyter Notebooks on working with Python, raster data, vector data, regressions, autocorrelation, and multicollinearity. Be sure to keep up with the work coming out of the CHaRTS lab on Twitter here!
Find the paper here: https://doi.org/10.1175/AIES-D-22-0065.1

Pingback: Today in disaster resilience (10 March 2023) – Disaster Resilience News
Pingback: Nonstationary stochastic watershed modeling – Water Programming: A Collaborative Research Blog