
This poster was written by Antonia, with contributions and editing help from Dave
The goal of this blogpost is to provide some guidance on designing a scientific poster, with a particular focus on the visuals of the poster, not its scientific content. A lot of these tips come from reading other resources (shoutout to the Better Posters blog) and from personal experience, so this is certainly not gospel, but a list of things to be mindful of when designing your poster.
#1 The main purpose of your poster is to grab attention and start conversation, not to explain everything you did
Giving details about your experiment should be reserved for your paper and, to a lesser extent, an oral presentation. This means two things:
- It’s important to use visual elements that attract attention (especially considering the sensory overload of someone walking in a large poster hall) and that can be perceived from afar.
- It’s important for at least one of these visual elements to serve as an ‘entry point’ to the poster, i.e., an element with a lot of visual weight that draws the viewer in and sets them off to a path of reading the rest of the poster. An ‘entry point’ visual element can be a large headline title, a photograph of something related to the subject-matter, or even a compelling graph (maybe something more conceptual/simple rather than a detailed nuanced figure).
A good example of a poster using an entry point element is this poster, which uses a large font on the title, as well as background color to draw the eye to that poster element first and then prompt you to start reading.

#2 The poster should have a narrative
If you were to summarize your poster in 3-4 sentences, what would they be? Try to think of those 3-4 sentences and use them as the main sections of your poster. Depending on the scientific discipline, this could be something like i) past evidence has shown something interesting, ii) we hypothesized that X might be related to Y, iii) we tested this using ABC method, iv) and we found out that we were wrong. You could use “Introduction”, “Methods”, “Results” sections on a poster (they do mirror the 4 statements above), but try to think of their connections as part of a cohesive story. I am also personally a fan of NOT using “Introduction”, “Methods”, “Results” as headings. Instead, I like to use the precious real estate of a heading to deliver a key message from my work. For example, instead of “Methods” as a heading, I can use “Innovative application of a neural network”. Here’s an example poster doing this.
#3 Informative and beautiful design hinges the balance between similarity and contrast
This is something I picked up from the Better Posters book. Similarity and contrast can refer to many elements of your poster: heavy vs light fonts, thick vs thin lines, light vs dark colors, etc. Too much similarity (e.g., everything in one color, every text the same size) looks boring. Too much contrast (e.g., many different colors, many different fonts) looks confusing. Using contrast strategically helps not only make something more visually appealing but also orient and structure your poster. A good example is shown below. Notice the differences in font size and thickness across the title, subtitle, headings, and text. Also notice the strategic use of color: white background with bold green headings and colorful icons that attract attention. Now imagine if the author used those colorful icons all over the poster, or if the white background of the text was just grey, it would look messy and hard to read. Contrast in size and placement also helps orient the viewer on the order they should look at things.

#4 Use a color palette of 2-4 main colors for everything in the poster
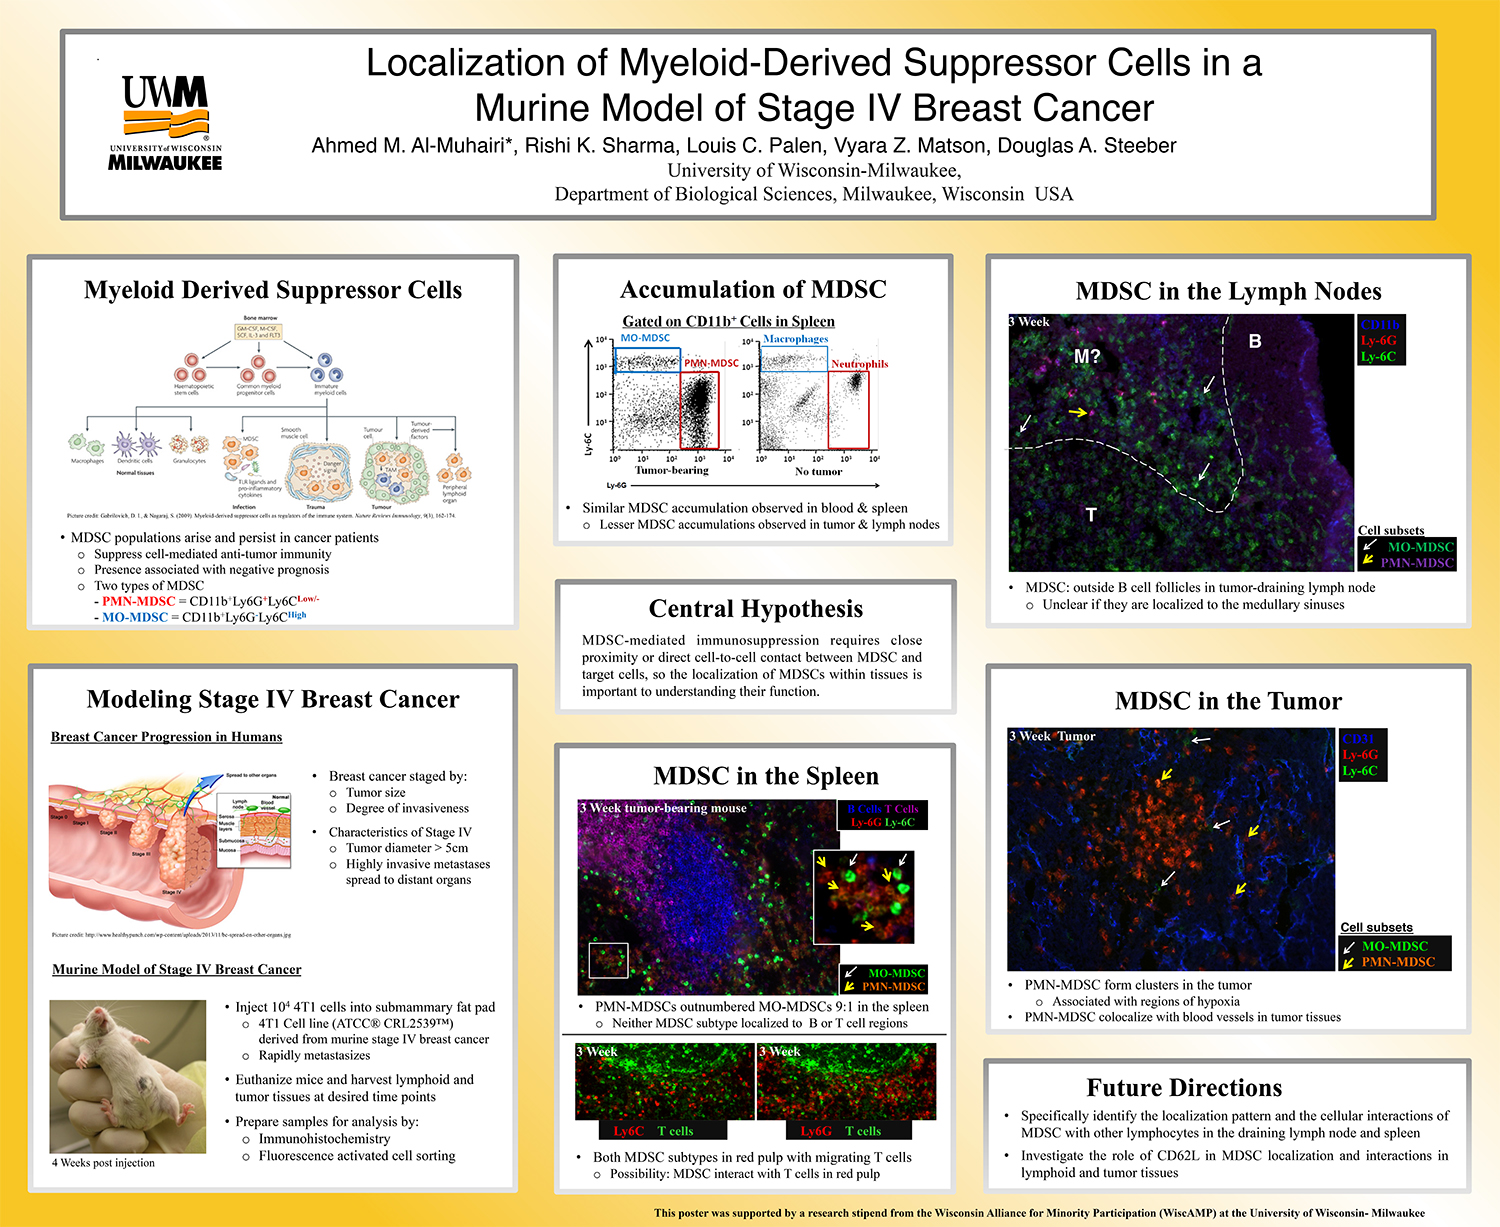
You’d be surprised about the difference this makes. A good color palette makes everything look coherent and the poster look ‘whole’ (rather just a bunch of figures you plopped together to make look like a poster). This means that your figures match the other graphical elements of your poster. Here’s two examples below (the first poster I used is also a good example of this). In the left-hand side example, the author used the yellow-orange-red color scheme of the main results figure as the color scheme of the entire poster (I’ll talk a little more about how to achieve this below). Other things to consider when choosing a color palette is color-blindness and the elements of your figure that cannot be a different color. An example of this can be seen in the right-hand side example, where I had to use a specific project logo and banner so I picked the background color of my title box to match (I also matched the yellows, the reds and the blues, but that might be less apparent).


#5 Use scalable vector graphics (i.e., not pixel graphics) for your figures
There’s many good reasons for this, outside poster design, with a nice overview by Jazmin here. Their main benefit when designing a poster (besides the fact that they are infinitely scalable) is that you can customize the colors of your figure post-creation. For example, I changed my mind about the blue I’m using in my plot, and I want to use a royal blue instead of a navy blue. In graphic editor software (such as Adobe Illustrator) this simply means that I select everything in royal blue and just switch the color, without needing to go back to my code and rerun and regenerate the figure. Using Illustrators color swatches can also make this a breeze.
Last mini tip: Outside of these tips, when designing a poster or a presentation, try to be mindful of spacing and alignments. It makes a difference on giving a perception of something more polished and it also impresses alignment-obsessive people (*cough* *cough* Antonia).
